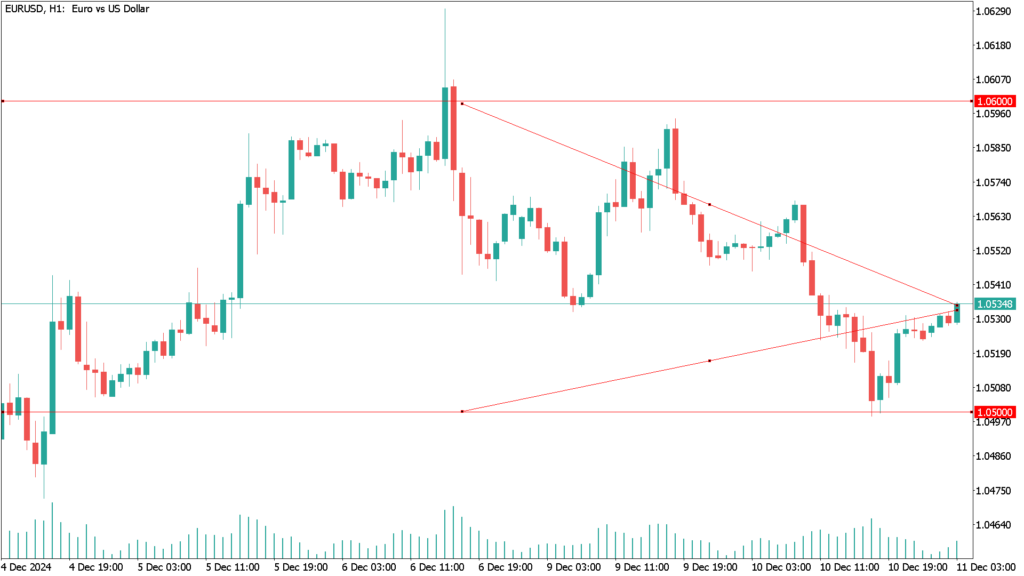
The EUR/USD pair lost nearly 0.2% on Tuesday, marking its third consecutive day of declines and testing the critical 1.0500 level as the euro’s short-term bullish recovery wanes. The pair has shifted to a more cautious stance ahead of Wednesday’s release of the Consumer Price Index (CPI) and the European Central Bank’s (ECB) upcoming interest rate decision on Thursday.
The November U.S. CPI report, one of the last significant data releases before the Federal Reserve’s final monetary policy meeting of 2024, is set to play a pivotal role. Indications that inflation has stalled could diminish expectations for a third consecutive rate cut on December 18. Market consensus anticipates headline CPI inflation to edge higher to 2.7% year-over-year from 2.6% in October, while core CPI is projected to remain stable at 3.3% year-over-year. According to CME’s FedWatch tool, traders currently assign an 85% probability to a quarter-point rate cut at the Fed’s December meeting.
The ECB’s interest rate decision on Thursday is also in sharp focus. Analysts expect a quarter-point reduction, which would lower the main refinancing operations rate to 3.15% from 3.4% and the deposit facility rate to 3.0% from 3.25%. This move underscores the ECB’s cautious approach amid ongoing economic uncertainty in the eurozone.
EUR/USD Daily Technical Analysis for December 11th
The EUR/USD pair remains in a neutral stance, trading within an ascending triangle pattern. Price action has shown higher lows while facing resistance at the key psychological level of 1.0600. Currently, the upper boundary of the triangle caps gains, nudging the pair closer to the lower boundary around the 1.0550 level, which aligns with dynamic support provided by the moving averages.
From a moving average perspective, the 100-day simple moving average sits above the 200-day simple moving average, signaling a bullish trend or suggesting that support at lower levels is likely to hold rather than break. A sustained upward move could push the pair above the triangle’s peak, potentially resulting in a breakout equal to the structure’s height—approximately 250 pips.
The stochastic indicator sits in the oversold zone, signaling bearish exhaustion. A turn to the upside could suggest buyers are ready to regain control. Additionally, the oscillator shows ample room to move higher before entering the overbought zone, supporting a continuation of the upward trend. The relative strength index (RSI) also indicates further room to the downside before reaching oversold levels, suggesting bearish momentum could persist briefly before reversing.
A break below the triangle’s lower boundary could trigger a decline equal to the formation’s height, whereas a breakout above the upper boundary may initiate a significant bullish extension.
Conclusion
The EUR/USD pair’s immediate trajectory hinges on upcoming U.S. inflation data and the ECB’s monetary policy decision. While technical indicators suggest mixed signals, the fundamental backdrop is expected to dominate, dictating the pair’s near-term direction. Traders should closely monitor both the CPI release and ECB rate decision for potential volatility.


