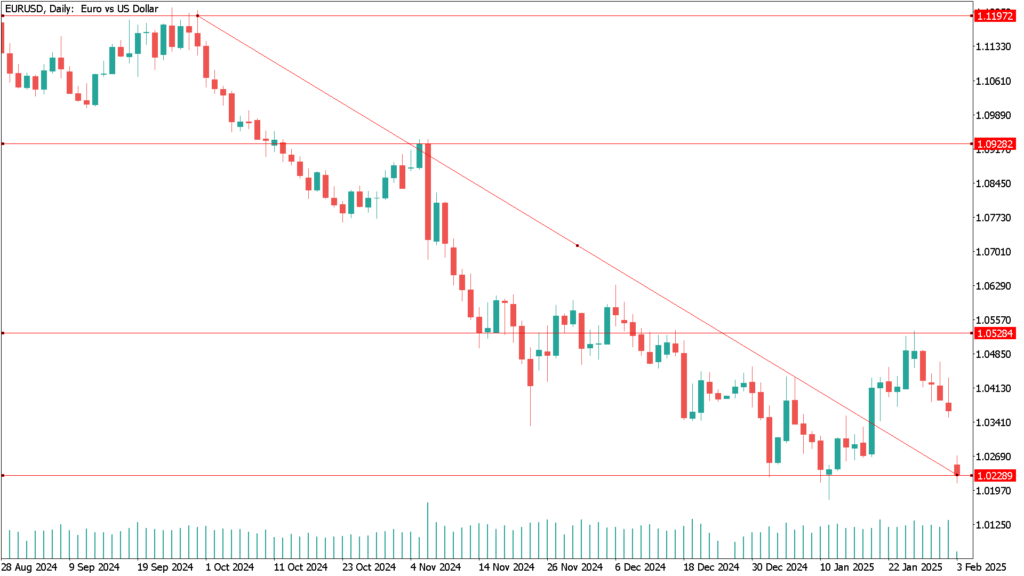
During the early hours of Monday, the EUR/USD currency pair witnessed a significant decline, falling to the 1.0200 area, marking a three-week low. This movement brings spot prices dangerously close to the two-year low established in January, leading some investors to question whether the pair is entering a prolonged downtrend that has persisted for several months.
A massive rally in the US dollar (USD) across the board is primarily attributed to the newly imposed tariffs by US President Donald Trump. Over the weekend, it was announced that a 25% duty would be imposed on imports from Canada and Mexico, in addition to a 10% tariff on goods from China. This hardline stance signals the potential start of a global trade war, discouraging risk appetite in the markets. Consequently, there has been a significant flight to safe-haven assets, supporting the USD and increasing selling pressure on EUR/USD.
In a separate development, President Trump announced on Friday his intention to impose tariffs on products imported from the European Union, further aggravating the euro’s situation. This comes alongside the European Central Bank’s (ECB) dovish stance, which has systematically weakened the euro. The euro has remained under pressure since the ECB cut borrowing costs by 25 basis points last Thursday and hinted at further reductions in December.
This dovish ECB stance sharply contrasts with the Federal Reserve’s (Fed) hawkish position, reinforcing expectations of further EUR/USD depreciation. However, the recent decline in US Treasury bond yields may hinder the dollar’s upward trajectory, potentially offering some near-term support to the euro.
EUR/USD Daily Technical Analysis for February 3th:
An analysis of the EUR/USD daily chart reveals several key dynamics that may influence the pair’s behavior in the short term. Currently, the pair is near the 20-period simple moving average (SMA), which maintains a slightly upward tilt. However, the 100-period and 200-period SMAs remain significantly higher, signaling strong resistance at these levels.
From a technical indicator perspective, momentum remains neutral, oscillating around the 100-line without a clear directional bias. In contrast, the Relative Strength Index (RSI) has recently been trending downward and is currently at 47. If the pair breaks below the key 1.0350 level, this move would be significant.
If EUR/USD succumbs to selling pressure and falls below 1.0350, the next critical support level is at 1.0300. A breach of this mark could push the pair toward its January low of 1.0177. On the resistance side, the pair faces an initial barrier at 1.0450, followed by a stronger resistance level at 1.0532, the previous weekly high.
These support and resistance levels, along with technical indicators, suggest that traders must closely monitor market signals in the coming days. Careful attention to these factors will be essential for making well-informed trading decisions in the EUR/USD market.


