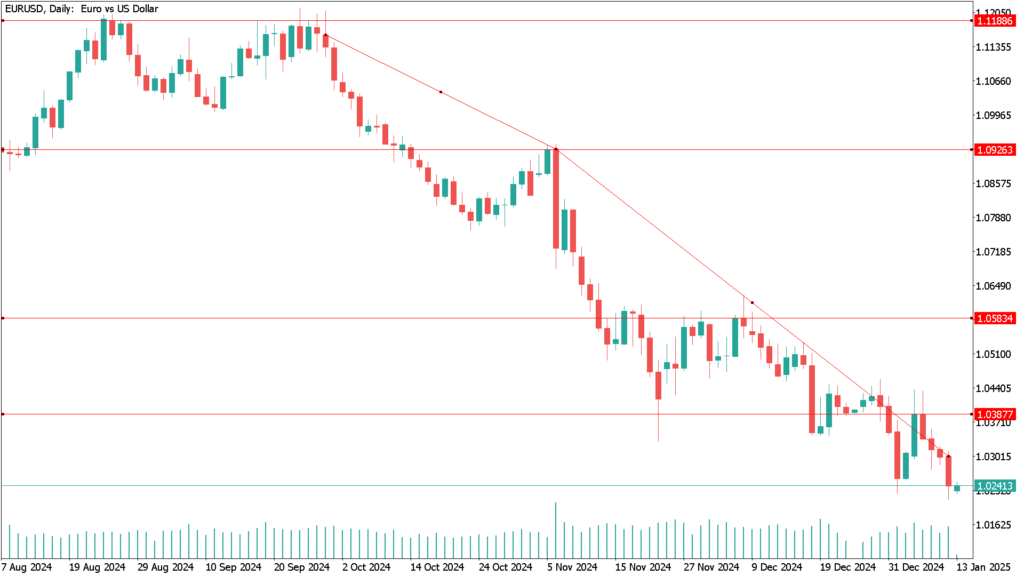
The EUR/USD continues its downtrend for the fifth consecutive session, trading around 1.0240. The pair appears to face persistent pressure as the U.S. dollar strengthens, buoyed by better-than-expected employment growth in the U.S. for December.
U.S. Labor Market Data Bolsters the Dollar
Data released on Friday by the U.S. Bureau of Labor Statistics revealed that nonfarm payrolls increased by 256,000 in December, significantly surpassing market estimates of 160,000 and outpacing November’s revised figure of 212,000. Additionally, the unemployment rate edged down from 4.2% in November to 4.1% in December.
However, there was a slight decline in annual wage inflation, as the change in the average hourly wage decreased to 3.9% from 4.0% in the previous reading. Despite this minor dip in wage growth, the robust labor market data supports the Federal Reserve’s stance on maintaining current interest rates. According to CME’s FedWatch tool, financial markets anticipate the Fed will keep its benchmark interest rate steady in the 4.25%-4.50% range during its meeting on January 28-29.
Euro Faces Headwinds Amid ECB Policy Outlook
The euro is struggling against the dollar as traders factor in expectations of four rate cuts by the European Central Bank, which are predicted to occur at each meeting through mid-year. Policymakers appear content with this outlook as inflation pressures remain subdued in the eurozone.
Last Wednesday, François Villeroy de Galhau, an ECB policymaker and Governor of the Bank of France, remarked that while price pressures might slightly increase in December, the ECB intends to continue moving towards the neutral rate “without a slowdown in the pace between now and the summer,” provided that incoming data confirm that inflationary pressures will not persist.
EUR/USD Daily Technical Analysis for January 13th
From a technical perspective, EUR/USD shows room for further declines. Technical indicators are trending downward in negative territory, still far from oversold levels. Additionally, the pair has consistently failed to breach the bearish 20 SMA, which currently acts as dynamic resistance near 1.0380. On the daily chart, the 100 SMA has crossed below the 200 SMA after maintaining a position above it for approximately five months. Both moving averages are now hovering near the 1.0800 level, signaling further downside potential and highlighting the strength of sellers.
The September 2022 high at 1.0197 serves as immediate support, followed by the psychological level at 1.0100. A break below these levels could bring parity into view, although significant further declines are unlikely in the near term. Short-term support exists in the range of 1.0300-1.0330, with additional resistance at the 1.0400 level.


