
The British pound (GBP) aims to reach multi-month highs against the US dollar (USD). This week, alongside recent CPI data showing unexpected inflation persistence in the U.S., pay attention to wage data and further inflation figures.
Sterling is likely to reach its highest level in several months against the dollar this week, boosted by positive signals from technical indicators.
However, any weakness from the UK wage data release, or a surprise in the remaining US data releases could generate large-scale selling positions.
The gains on the GBP side are largely due to weakness in the USD broadly coupled with a weaker than expected set of economic data last week. We are now in a key week of US CPI data and awaiting UK wage data to see what impact it will have on GBP/USD.
Overall, sterling is expected to be the best-performing G10 currency in 2024 amid improving sentiment regarding the UK economy. Expectations are high for the UK’s economic recovery from the recession experienced in the second half of 2023, bolstered by a broad-based improvement in economic survey data. Many believe that this may be the time for the GBP to take off after a not so good few years in the currency market.
Also, markets have the feeling that the Bank of England (BoE) could make interest rate cuts after the European Central Bank (ECB) and the Federal Reserve (Fed), favoring UK bond yields compared to other markets, leading to broadening demand for sterling in the market. There is a risk that the data could challenge this outlook and shake the market into betting more on an interest rate cut by June, which would lead to a change in trend, although this will only be known by the end of this week. But do not forget that a possible failure in the data may reverse the gains made in recent days by the GBP.
Daily technical analysis GBP/USD March 13th
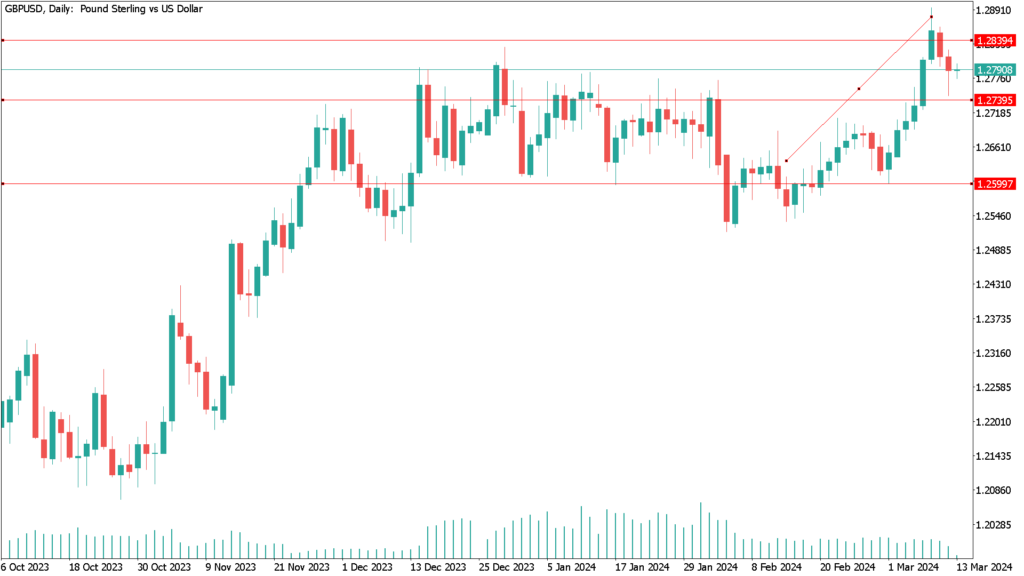
The GBP/USD pair started a decline from the 1.2890 area. The pound sterling (GBP) traded below the 1.2820 area against the US dollar (USD).
For now, the pair is trying to recover from a 23.6% breakout that took the pair to touch levels near 1.2746. On a bullish view, the pair may reach 1.2800 resistance. Its next resistance may be at 1.2820.
On the bullish side, the GBP/USD chart shows that the pair is facing resistance near 1.2800.
On he bearish side, if the pair breaks below the trend support at 1.2745, it could fall further. Everything will depend on how the GBP/USD pair behaves and reacts to the data releases in both countries to see if the trend will continue to make gains or if there will be a move to break this trend.

