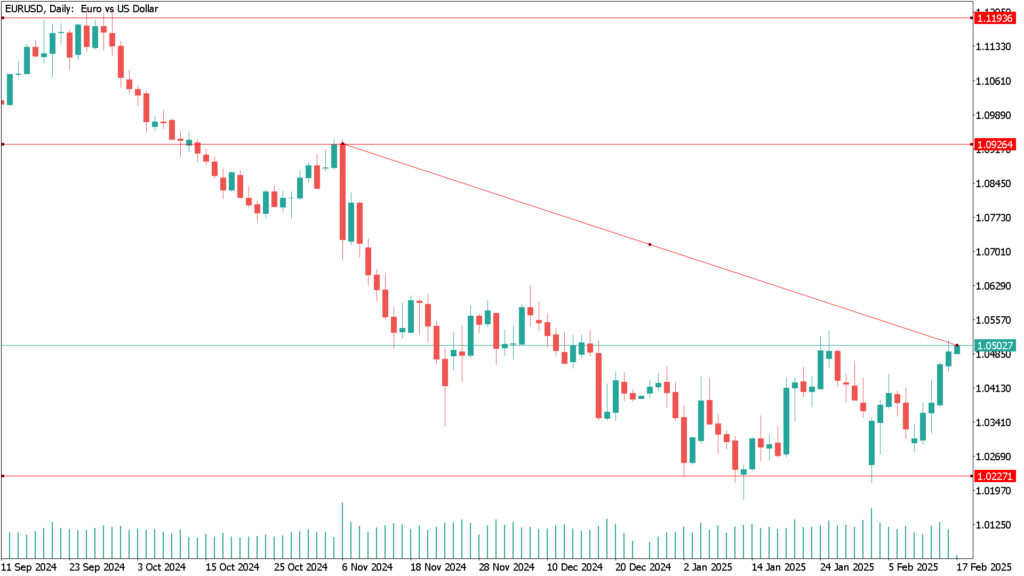
EUR/USD paused its four-day winning streak, hovering around 1.0490 during Asian trading hours. Liquidity may remain thin in the North American session as all major U.S. financial markets will be closed on Monday for Presidents’ Day.
The pair has recently gained momentum as the implementation of U.S. President Donald Trump’s reciprocal tariffs is taking longer than originally anticipated. Additionally, weaker-than-expected U.S. economic data has weighed on the U.S. dollar (USD), lending more support to EUR/USD. Despite lingering inflation risks, disappointing U.S. retail sales data has fueled speculation about the Federal Reserve cutting interest rates later this year.
Data from the U.S. Census Bureau on Friday revealed that U.S. retail sales dropped 0.9% in January, following a revised 0.7% increase in December (previously reported as 0.4%). The decline was sharper than the market’s expected 0.1% drop.
Meanwhile, a note from JPMorgan suggests that EUR/USD could rise by as much as 5% if a ceasefire in Ukraine is reached and gas supplies resume. Reports indicate that Trump and Russian President Vladimir Putin have agreed to initiate negotiations to end the conflict. According to sources cited by BBC, Trump administration officials are set to meet with their Russian counterparts in Saudi Arabia on Tuesday to discuss a potential peace agreement.
EUR/USD Daily Technical Analysis for February 17
The daily chart reflects a bullish bias, though additional confirmation is needed for further upside momentum. The Momentum indicator is moving higher from below its midline but lacks a strong directional slope. Meanwhile, the Relative Strength Index (RSI) is advancing around 60 at a moderate pace.
EUR/USD continues to trade above a slightly bullish 20-day Simple Moving Average (SMA) near 1.0400, but remains below the 100-day SMA, which acts as dynamic resistance at 1.0585.
Support Levels:
- 1.0440 (February 5 high)
- 1.0400 (next key support level)
- A break below 1.0400 could extend losses toward 1.0320, with further downside targeting 1.0276 (weekly low).
Resistance Levels:
A breakout above 1.0527 could expose 1.0639 (December’s monthly high).
1.0527 (January’s monthly high)


